Increase retail productivity with Premium BI.
As a data-driven business, Premium constantly works to uncover opportunities for our clients. One of the biggest opportunities we see in the retail industry is increased productivity. Truly leveraging your data to identify opportunities and glean actionable insights ensures you don’t miss out on the results your business deserves.
Premium’s business intelligence platform Premium BI is central to this data-driven approach which delivers interactive, customizable dashboards to our clients. With access to interact with multiple sources of data in real-time and produce powerful visualizations, you gain more than just analytics – you know exactly how to capitalize on the opportunity.
By collaborating with clients to identify their dashboard needs, Premium uses Premium BI to:
- Provide interactive mapping visualizations giving detailed store-level visibility to execution results in real-time.
- Demonstrate the impact of robust training strategy on in-store sales.
- Design dashboards to meet specific program objectives.
- Help programs become truly data-driven.
- Move beyond data collection by combining data sources to uncover true insights.
Powerful visualizations providing real-time visibility.
At 1:21 pm CST, Premium started the clock, beginning field execution for an iconic smartphone launch. Over 4,000 service orders were deployed to 1,400 reps in the field. In our Operations Support Center, Premium’s war room of 70+ on-call personnel monitored execution and actively analyzed data to take real-time action thanks to Premium BI’s live dashboard.
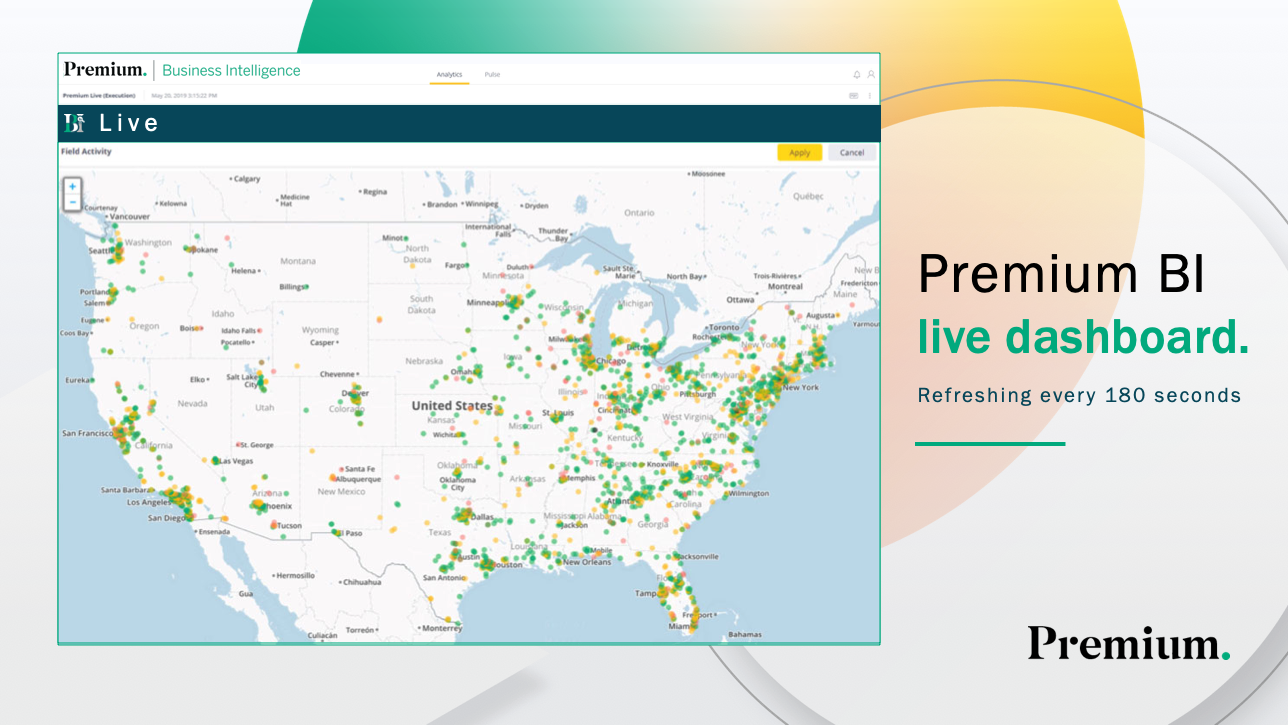
Premium’s operations, analytics, IT and client services teams partnered with the client to identify key focus areas and build an interactive map showcasing where reps were, which were complete, and which stores had issues.
Kimberly Gaddis, Director of Client Operations said, “There was a lot of anticipation knowing [that] when our client said go, we’d begin to see the map light up with reps in-store and locations successfully completed.”
Because Premium was given only 48 hours to reach 100% completion, the custom map dashboard was an integral part in ensuring challenges were identified and addressed as quickly as possible. Gaddis confirmed, “The visualizations allowed us to digest field trends at a glance. Having access to continuously updating data, we could activate the team and resolve issues before they became more widespread.”
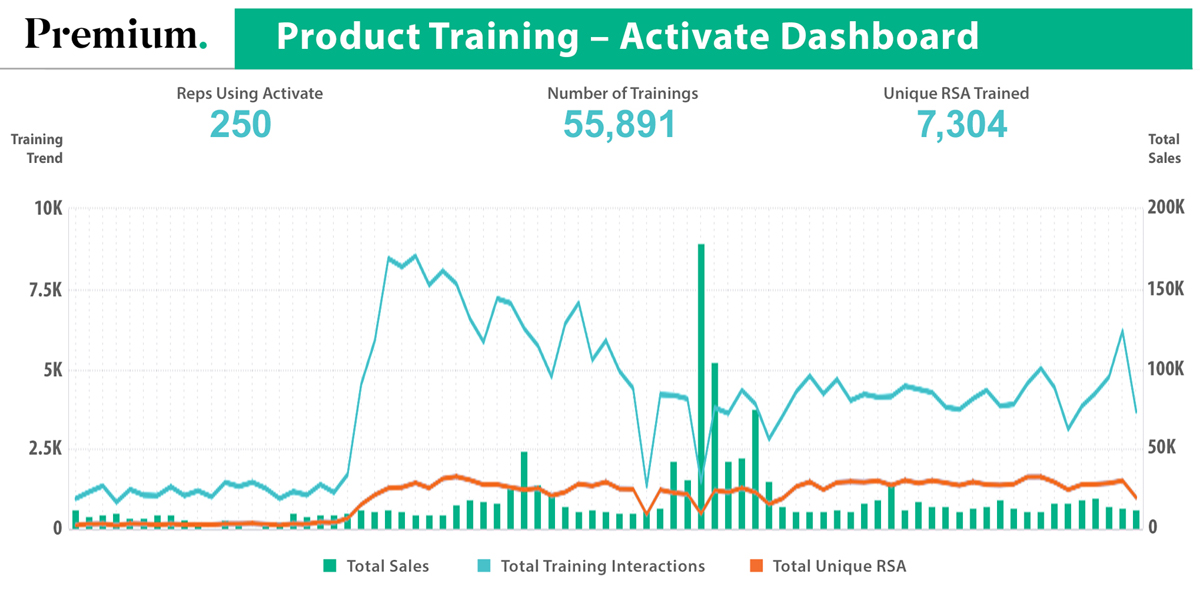
Reinforcing training’s impact.
When your team is focused on heightening brand awareness and increasing sales, you’ll most likely want to measure the impact of your training strategy on those goals. By overlaying sales and training metrics in a single dashboard, Premium enabled a team focused on retail associate product knowledge to understand regional trends and plan future training content based on what topics drove the most engagement or needed additional reinforcement. By performing a regression analysis, we were able to illustrate how the training strategy resulted in a 26% increase in sales at covered stores vs. uncovered stores.
Delivering dashboards on specific program objectives.
For a category program where action used to be based on anecdotal theories, we created a multi-retailer inventory and display dashboard. Clients can now monitor out-of-stock percentages for all key SKUs in every grocery retailer in the country, as well as drill down at the store level. After an audit of each store’s home and checkout lane location, along with quantifying external factors that hindered compliance, we uncovered a category exclusivity issue that was suspected, but not previously proven.
In the consumer electronics space, Premium BI is an essential tool to track retail performance. More than 150 team members examine results through more than 40 dashboards customized for a single program. Our consistent monitoring ensures we optimize inventory and staffing levels for efficient sales operations and quality customer experience. Sales Managers have visibility to recognize top performers and provide gratification and motivation for the Sales Specialists in each store. Additionally, program leaders use compliance dashboards to identify areas of improvement, triggering strategy planning sessions or coaching.
Becoming truly data-driven.
We’ve also supported new clients arriving at Premium without having had prior access to basic reporting. Without a true understanding of store visit compliance or performance, clients had no insight to guide changes in strategy. In these cases, we’ve implemented dashboards to establish a baseline for performance and evaluate areas of opportunity and success to continue optimizing coverage and execution. We’re also able to identify and address macro trends and market opportunities to increase focused efforts at certain retailers and markets to achieve stronger business growth.
Acosta Group’s SVP, Shopper Insights + Thought Leadership Kathy Risch said, “I always recommend clients incorporate business intelligence into their day-to-day operations and strategies. This simply means understanding the reality of what’s happening today so your actions tomorrow and next quarter provide even greater ROI.”
Combining data sources for true insights.
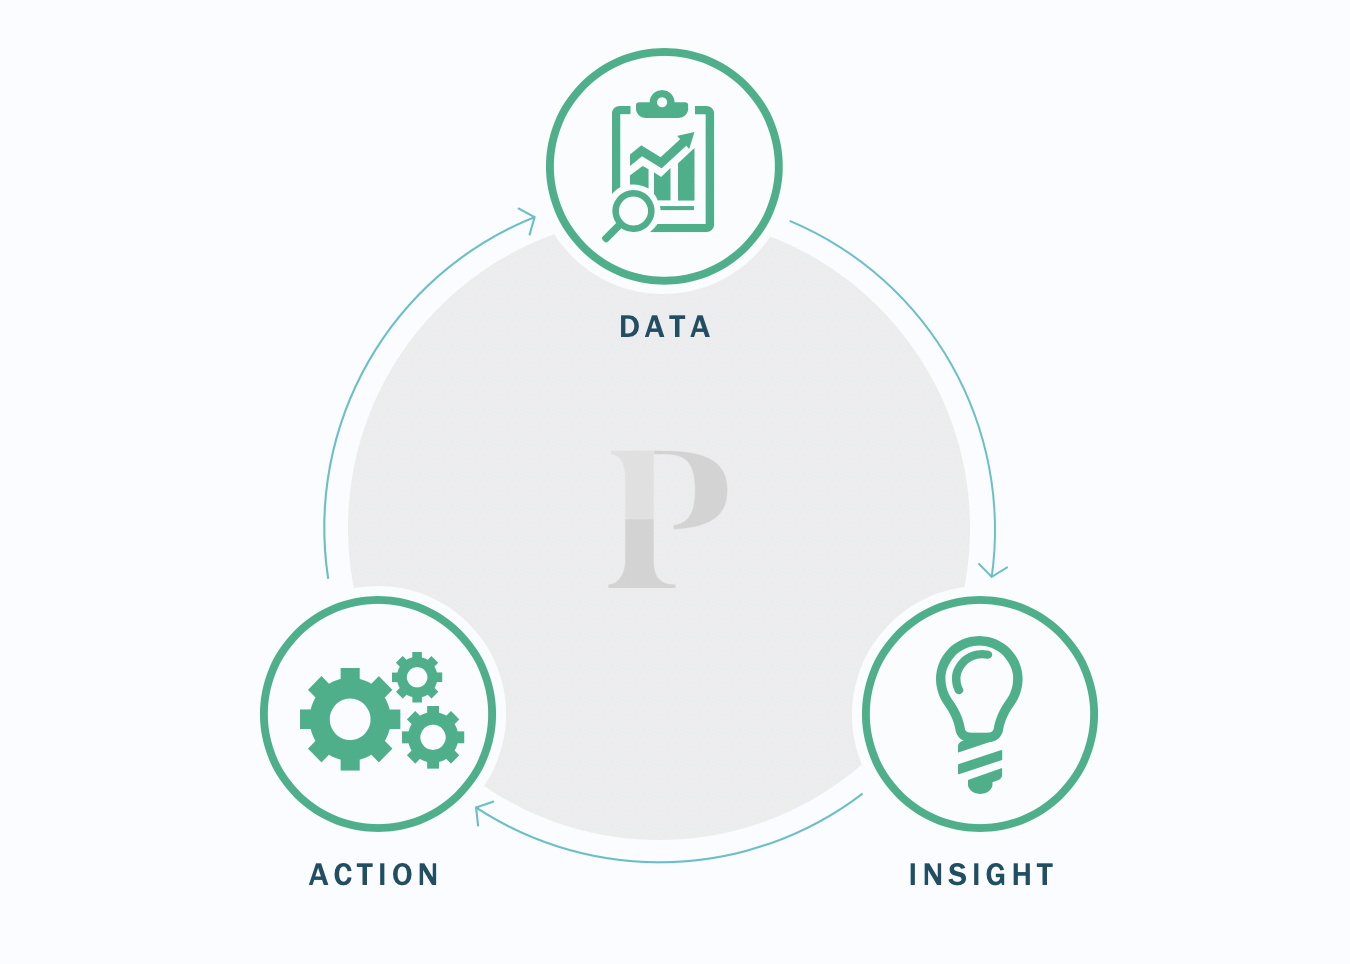
The ideal business partnership with our clients involves collaboration to answer key business questions – turning data into insights into recommended actions. This type of partnership often requires new methods of analysis and new sources of data which could be syndicated third-party data or primary qualitative and/or quantitative research. It’s only when we combine all of these data sources together that we have a full understanding of shopper needs and purchase drivers, alongside retail and product dynamics. A more complete picture enables us to drive growth for our clients and retailers.
Methodologies, tools and data sources vary depending on the business situation, but the common thread is that we use data to uncover new insights. The insights (or business intelligence) drive us to action, and the action ultimately creates growth.
What our clients say.
While the examples above illustrate a variety of ways we’ve improved productivity and program ROI for our clients, we think you should hear it from them directly:
- “This is great. Now we have access to information and can really see what’s going on.” – Walmart PSP client on an executive summary dashboard
- “That’s what I want. You have the best scorecard in CPG that I’ve ever seen.” – Client partner on OOS/display dashboard
- “Oh man, this is awesome. Much more convenient than the spreadsheet I was using.” – Walmart Operations Senior Manager on a program sales card
Think your brand or retail program might benefit from adopting Premium BI? Let us know!