
Data Visualization
Uncover insights, spend smarter and maximize ROI by closing gaps and capitalizing on market-specific opportunities.
Why it works
We interpret data to uncover trends and insights that increase efficiency, improve customer experience and drive sales.


Make data-driven decisions.
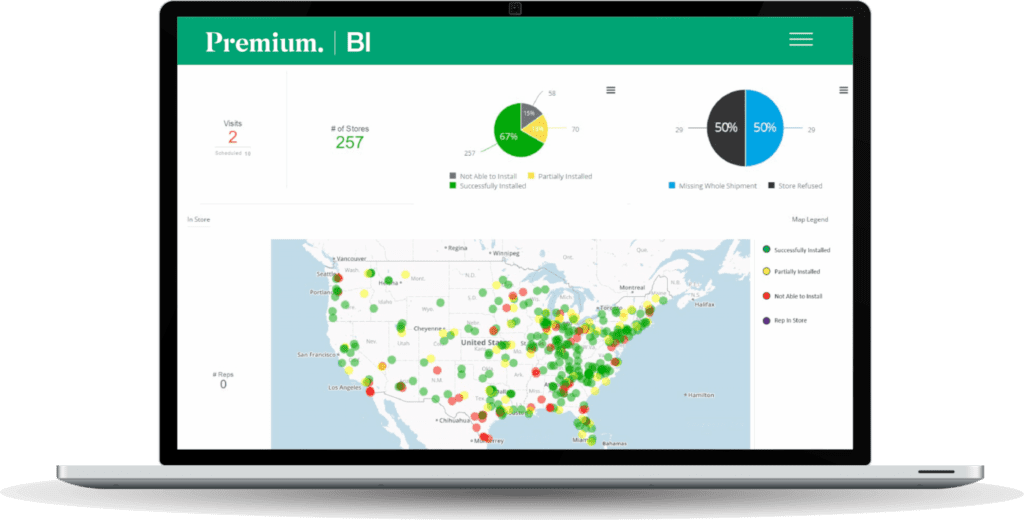
Through the Premium BI platform, our analysts consolidate labor, inventory, point of sale and exclusive third-party data sources to design interactive, automated dashboards that refresh daily. With access to multiple sources of data and powerful visualizations, you gain more than just analytics – you know exactly how to achieve stronger business growth.

We consider the speed of development, the efficiency of the dashboard and its impact on our business a Global Best Practice.
– Sr. Director of Retail Operations
CONSUMER ELECTRONICS CLIENT
KEY BENEFITS
Premium analysis. Ready to galvanize action.
View interactive maps that offer detailed store-level visibility and inventory updates.
Combine data sources to uncover real, actionable growth opportunities.
Maximize productivity of field merchandising and optimize out-of-stock percentages.
Results
55
CLIENTS SUPPORTED
300+
CUSTOM DASHBOARDS
1,000+
ACTIVE USERS